Can Carnival Cruise Right Size the Ship?
It’s sink or swim for the world’s largest cruise company
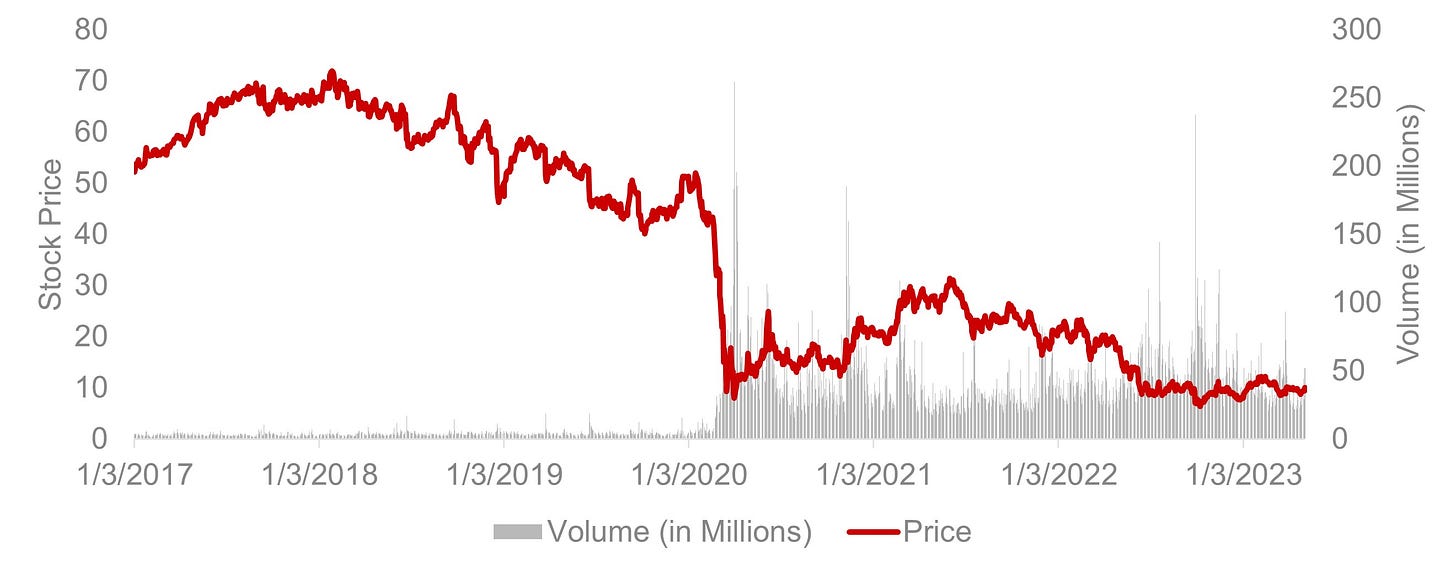
COVID-19 brought the cruise industry to a screeching halt. Carnival Cruise’s fleet of over 90 cruise ships was forced to halt operations in March 2020.
Restarting a business with hundreds of thousands of employees and many millions of passengers a year is a monumental task. Now, with operations having returned to normal and bookings surging, Carnival must focus on increasing cash flow to manage its debt burden without having to tap the capital markets again.
Failure comes with a huge cost. Putting Carnival through a bankruptcy process would require handing an otherwise profitable company over to lenders.
The company’s debt burden combined with consistently missed expectations (including a 14% revenue miss in Q3 2022) hurt the market’s confidence in Carnival’s ability to recover. Carnival’s Q1 2023 performance and recent strength among competing cruise liners Royal and Norwegian have improved sentiment, but CCL has a long road to recovery.
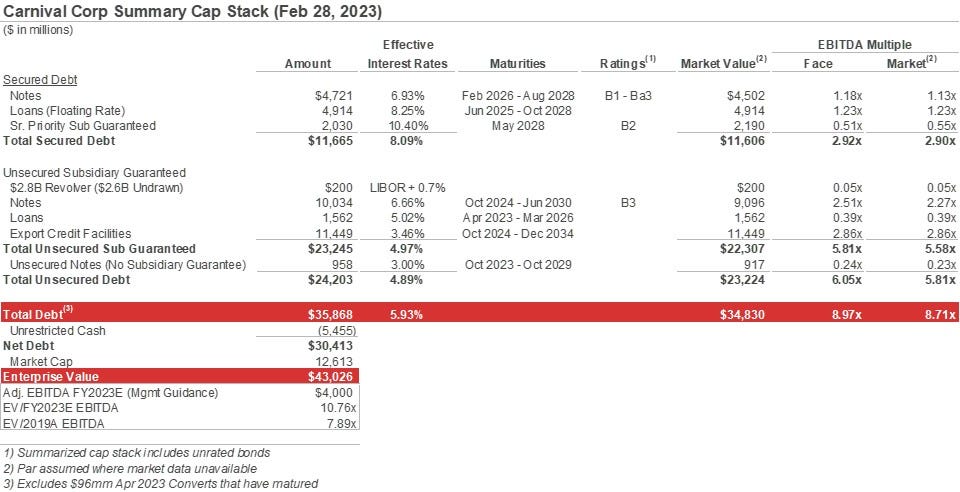
With negative LTM EBITDA, $36B in debt, and $9B of maturities through 2025, Carnival has a crucial year ahead. It’s sink or swim for the world’s largest cruise company.
The Situation
Carnival had a banner year in 2019, generating $21B in revenue and $5.5B in adjusted EBITDA.
From early 2020 onwards, global travel restrictions, social distancing measures, and public health concerns brought the cruise industry to a standstill. Faced with an impossible situation, Carnival experienced massive losses in revenue and mounting operational costs.
To stay afloat, Carnival took several measures, including:
Raising capital: FY2020 - 2022, Carnival raised over $5.4B through equity raises and over $23B in debt to increase its cash reserves and shore up liquidity.
Cost reduction: Carnival implemented cost-saving measures such as taking the fleet out of service, laying off employees, reducing marketing expenses, and deferring capital expenditures. Despite these measures, the company has significant fixed costs that could not be avoided during the halt.
Selling assets: Carnival generated ~$750mm in proceeds from selling ships in FY2020 - 2022 to reduce costs and streamline its fleet.
Reduce order book: In an effort to manage its debt burden Carnival is scaling back its ship orders, expecting 4 ships through 2025, no ships in 2026, and “just one or two new builds each year for several years thereafter” per management.
Q1 2023 Results
Carnival is showing early signs of a turnaround. The company experienced its highest booking quarter in history. Higher volumes from travel agents has driven a higher percentage of new-to-cruise customers — customers Carnival hopes to retain.
99% of Carnival’s fleet was back to service by Q4 2022. Bookings in Q1 2023 were at 95% of Q1 2019 levels. Management stated that debt has peaked, and they do not expect to raise additional equity this year. They expect to be able to pay down upcoming maturities with excess liquidity (consisting of $5.5B in cash and $2.6B in availability under their revolving credit facility).
But.
Even if Carnival can return to its pre-COVID glory as a cruise liner, its cap stack needs to be addressed. The company’s debt increased from $11.5B at the end of FY2019 to ~$36B today.
The Cap Stack
Carnival will face ~$9B of debt maturities from Q2 2023 through the end of 2025 and nearly $6B in interest over this period (ouch).
At its current effective interest rates, Carnival can expect to pay ~$2.1B annually in interest. For every $1B in debt repayment, Carnival can save ~$60mm - $100mm in interest.
If Carnival can breakeven on a free cash flow basis they can start to use their excess liquidity to paydown debt. The company currently has $8.1B in liquidity and a minimum liquidity covenant of $1.5B. Paying down ~$6B of debt can save $300-$600mm per year in interest payments but risks exhausting liquidity without being in the clear operationally. Carnival will have to be strategic about when early repayments are made, and may be better served by making the interest payments and looking to refinance its most expensive debt when possible.
Q1 2023 revenue is nearing 2019/2020 levels, and management’s adjusted EBITDA guidance for 2023 is $3.9B - $4.1B.
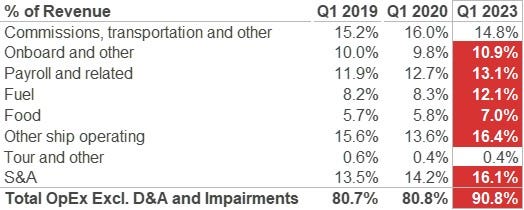
Compared to 2019, Carnival has higher fuel costs, inflationary pressures, higher interest rates, and higher debt obligations. Fuel costs in particular have increased significantly, representing 12% of revenue in Q1 2023 compared to 8% in Q1 2019.
To meet debt obligations, not only will Carnival need to restore its booking volumes to at least its 2019 numbers, the company will need to pass cost increases on to consumers through higher prices.
Management’s 2023 expectations are based on stabilized fuel and inflation pressures and assumes bookings are at 2019 levels by Summer 2023. Recent earnings reports from competitors indicate bookings may exceed this pace.
Liquidity
Through 2025, Cap Stack estimates that Carnival will need to make ~$21.5B in cash payments towards interest, mandatory debt repayments, and capex, net of drawings on export credit facilities. Carnival has $5.5B in cash on hand and $2.6B in availability under its RCF, but must maintain $1.5B of that to comply with covenants. If Carnival burns through all its excess liquidity, the company will still need to generate ~$15B in Adj. EBITDA over the next 3 years.
Is this reasonable? If we assume management hits their $4B EBITDA target for 2023, recovers to 2019 EBITDA of $5.5B for FY2024, and increases EBITDA by 10% for FY2025 to $6B, Carnival can make it through. If we assumed a flat $5.5B for 2024 onward, Carnival would run out of cash by 2027 barring additional capital raises. These cases assume Carnival’s secured debt is refinanced as it comes due.
Carnival should be able to easily refinance $2.6B in 1L debt coming due in FY2025. Past 2025, Carnival’s survival will be contingent on its ability to repay or refinance some portion of the debt coming due in 2026 and 2027. Given where Carnival’s bonds are trading, the market’s view is that the company can skate by.
Carnival does not have much headroom under its coverage ratios but should be able to amend / get a waiver as it turns things around.
The net book value of Carnival’s ships is $37B, of which ~$30B is pledged as collateral to secured debt.
All in all, as long as Carnival can execute this turnaround, the cap stack can be managed with a few more years of pain.
The Business
Carnival generates the overwhelming majority of its revenue in two ways:
Passenger tickets
Onboarding spending
Historically, tickets make up ~60-65% of total revenue and onboard expenses make up most of the rest.
Cruises have evolved over the years from being all-inclusive packages to including a variety of onboard activities and stores including spas, art auctions, casinos, cybercafes and more. Cruise operators also sell excursions and local tours for the destinations they travel through.
The cruise industry experiences seasonality. “Wave” season in Q1 of every year is when cruise companies run their biggest marketing promotions and discounts (these “discounts” are typically built into prices already). The highest demand is typically in Q3, and Carnival’s highest share of operating income typically comes in this quarter.
The cruise business has high capital expenditures and high fixed costs. These create high barriers to entry, and over the years have driven consolidation in the industry. The three largest players (Carnival, Royal, Norwegian) control over 70% of the market. MSC Cruises is 4th place, with ~6% market share.
Fuel costs are one of Carnival’s largest expenses and have been rising in recent years. That said, Carnival generally has a good idea of how much fuel is used in each trip and can optimize ticket pricing and destinations to improve profitability. All they have to do is achieve high occupancy for their trips! Easy enough, right?
Cruises have a unique value proposition relative to land vacations. Cruises provide a more exotic experience with a better bang-for-your-buck. Compared to destination vacations, cruises are often cheaper. It’s no wonder the cruise industry had an annual passenger CAGR of 6.6% from 1990 - 2019.
Is Carnival the elusive “good business, bad balance sheet” distressed investors have been looking for?
Cap Stack’s View
Carnival is a highly levered, industry leading cruise liner in the midst of executing an ambitious turnaround. Buoyed by pent up demand in travel, Carnival has seen record bookings even compared to its pre-COVID levels. Its largest future capital needs (debt repayment and CapEx) have a high degree of visibility. Fuel costs and other inputs have increased, but the company has good internal visibility on its occupancy needs to cover these costs and generate profit. A record booking season and outperformance in recent earnings from competitors is encouraging.
Carnival has at least 3-4 years of liquidity runway to correct course, assuming management can meet EBITDA expectations for 2023 and meet or exceed 2019 levels in 2024. Leveraging unencumbered assets, refinancing secured debt, and strategically paying down debt to reduce interest burden can extend Carnival’s turnaround runway to 5+ years.
Recent earnings reports from competitors have been encouraging, meaning Q2 and Q3 for Carnival are likely to exhibit strong performance. In the years to come, Carnival will need to grow into its new capital structure by achieving high occupancy rates and growing revenue per customer.
In any case, the worst has passed for Carnival (can’t exactly get worse than being shutdown for over a year).
Will Carnival go bankrupt? Cap Stack’s view is… probably not. A severe economic downturn would change our opinion, but Carnival can likely survive through a mild recession given its liquidity position.
In fact, Carnival could be one of the turnarounds of the century.
At 2019 EBITDA levels and a 12x valuation (similar to pre-COVID), the implied share price would be ~$28 assuming no debt paydown (rough estimates).
The future of Carnival has huge execution risk as a result of high leverage that came out of an impossible situation outside of the company’s control. This turnaround would certainly be up there with the G.O.A.Ts.
Appendix: Historical Financials
Disclaimer: We are not financial advisors. This content is for educational purposes only and merely cites our own personal opinions. All analysis, including valuation, debt, liquidity, etc. is illustrative in nature and subject to revision.


